The raster data model represents data over a grid of evenly spaced rows and columns of cells, with a data value assigned to each cell, or pixel. Digital images, including aerial and satellite imagery, are stored using this data model. Read more about Descartes Labs raster applications in our Remote Sensing 101 Reference.
Rasters are well-suited to represent both continuous and discrete phenomena.
Continuous Data vs. Discrete Data
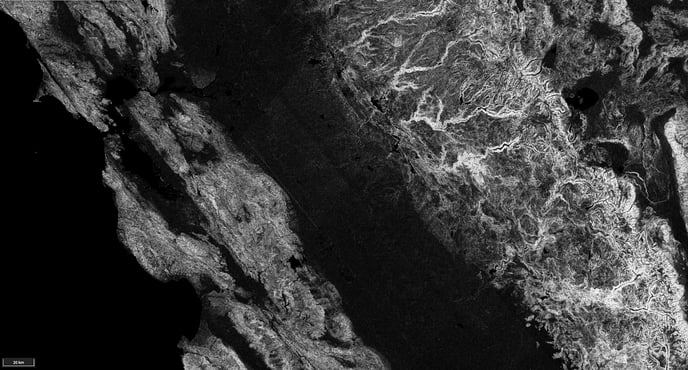
The Shuttle Radar Topology Mission (SRTM) product (top) contains slope data expressed in degrees, and is an example of continuous data.
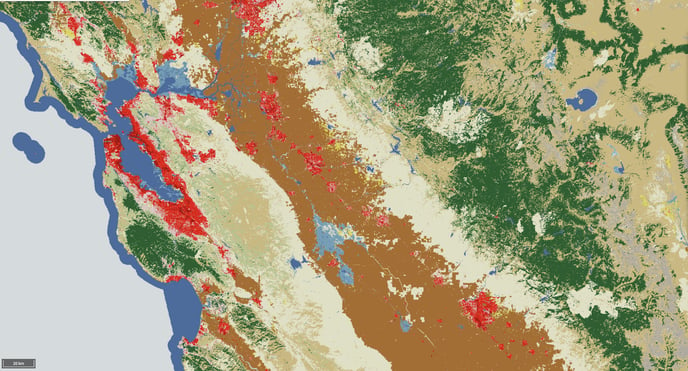
The National Landcover Classification Database (NLCD) displays categorical information, such as “urban” or “agriculture”, and is an example of discrete data.
Discrete - Each cell, or pixel, of discrete data is assigned a value corresponding to a category, such as land cover (forest, water, urban, etc.) or wildfire risk (high, medium, low). Discrete data can also be referred to as thematic or categorical data.
Continuous - Continuous data represents the measured or modeled value of the variable over each cell. Examples of continuous variables are spectral reflectance, elevation, atmospheric carbon dioxide, and surface temperature.
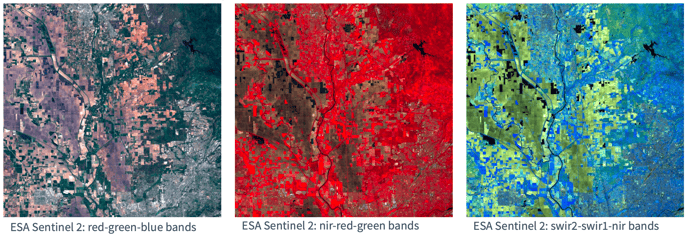
The most common type of continuous data you’ll encounter on the Descartes Labs platform are spectral reflectance values in aerial or satellite images, which provide information on the reflected and emitted electromagnetic radiation at each pixel location on the ground. Red, green, and blue pixel values come from the visible range of the electromagnetic (EM) spectrum, and are used to create true-color images that most closely match what we see with our eyes. A true-color image is shown in the left-most image of the figure below. We can create false-color images by visualizing portions of the EM spectrum outside of the visible range, but displayed in the red, green, and blue bands. By displaying information in this way, we get a sense for what the satellite is able to sense outside of the visible spectrum. For example, to make vegetation pop out in imagery, it is common to display the near infrared, green, and red reflectance values in red, green, and blue bands, respectively. Due to high near-infrared reflectance from vegetation, this false-color combination will show vegetation in red, as shown in the middle image of the figure below.
Descartes Labs stores individual images as scenes within our Catalog. You can search for imagery using the Catalog API or Catalog user interface, and load data through the Raster or Scenes APIs. The Scenes API wraps both Raster and Metadata APIs.
Common file formats: GeoTIFF, JPG/JPEG, netCDF