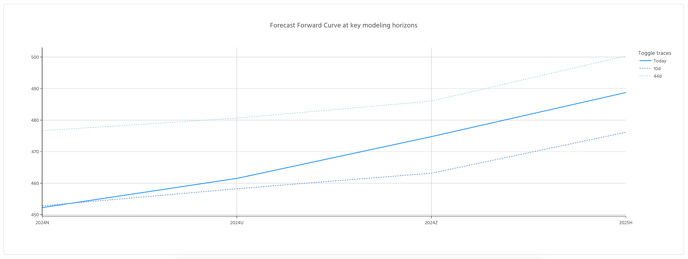
The Forward Curve Chart plots the individual futures contracts by expiration date (nearest to expire on the left) on the x-axis and each contract's most recent Close price on the y-axis. By default, the chart includes three different series:
- Today: The forward curve as of the most recent actual Close price for each contract.
- 10d: The forecast of the forward curve in ten (10) Days from the most recent Run Date.
- 44d: The forecast of the forward curve in 44 Days from the most recent Run Date.