Data Displayed
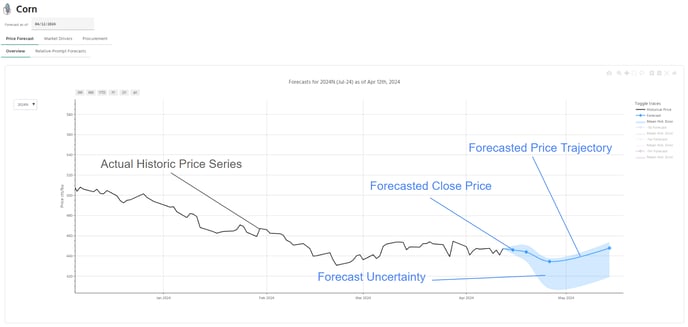
Price Forecast Charts display daily end-of-day (EOD) price data for the current front-month futures contract for the commodity selected. Data available for display includes the following:
1. The actual historical Close price (solid black line).
2. The forecasted Close prices (blue markers on solid blue line) in the future at each forecast horizon: 10-day, 22-day, 44-day, and 86-day.
3. A line of interpolation (solid blue line) that connects the forecasted prices.
4. Forecast uncertainty (blue shaded area).
Note: The units representing the price displayed on the y-axis are commodity-specific.
Selecting a Run Date
The datepicker element (upper left) can be used to select the Run Date of the price forecasting model(s). By default, the last available (most recent) run date is selected; this date is usually yesterday or the last date that the applicable exchange was open for trading.
By selecting a Run Date in the past, you are able to view the forecasts as-of that date. For example, if today's date is Wednesday, 3/13/2024, the datepicker will display yesterday's date, 3/12/2024, by default because it is the most recent Run Date. Thus, by default, you will be viewing the most recent price forecasts. If you use the datepicker to select a Run Date of 3/05/2024, you will be viewing the forecasts that the model produced on 3/05/2024.
Selecting/Deselecting Data Displayed
The legend shown on the right hand side of the chart is an interactive UI element. It allows selection and deselection of the series displayed in the chart. In addition to the series specified above ("Data Displayed"), you can select/deselect any of the following series:
- D-1 Forecast: The forecast as of one (1) Day prior to the latest Run Date (where "Day" is defined as a day in which the applicable exchange was open). E.g. if today's date is Wednesday, 3/20/2024, the latest Run Date was yesterday, Tuesday, 3/19/2024, and the "D-1 Forecast" is the forecast that was created on Monday, 3/18/2024.
- D-7 Forecast: The forecast as of seven (7) calendar days prior to the latest Run Date. E.g. if today's date is Wednesday, 3/20/2024, the latest Run Date was yesterday, Tuesday, 3/19/2024, and the "D-7 Forecast" is the forecast that was created on Tuesday, 3/12/2024.
- D-1M Forecast: The forecast as of approximately one (1) calendar month prior to the latest Run Date.
Note: These historical forecast series are identical to those that can be selected via the datepicker; they are made available as additional series on the chart in order to view how the forecasted price trajectory has changed over the past day, week, and month (approximately).